40386 North Shore Lane, Big Bear City, CA 92314, USA
e-mail: vayur@bbso.njit.edu
Crimean Astrophys. Observatory, 98409, Nauchny, Crimea, Ukraine
2000, Astrophysical Journal 540, 1143.
It is generally accepted that a two-ribbon flare (TRF) is due
to a reconnection process which happens in previously open magnetic
field. Here we use the BBSO high resolution observations of the
longitudinal magnetic field and H_alpha, and YOHKOH images of AR NOAA
8375, as well as a numerical method for reconstruction of the linear
force-free field and we show that the 2B/M8.4 two-ribbon flare on Nov
5, 1998 was a result of many reconnection processes between closed
magnetic loops.
The figure shows, that H_alpha flare ribbons were located at the
separatrices. This suggests, that reconnection between magnetic flux
represented with line 1 and the flux shown with lines 2 and 3 will
create new magnetic loops systems: the H$\alpha$ post-flare loop system
and a giant X-ray post-flare arch connecting the area a and the
flare ribbon A.
The radiative energy from the SXR emitting plasma for the Nov
5, 1998 flare, can be estimated as 4-7 x 1030 erg.
To estimate the lower limit of the energy released in the Nov 5,
1998 flare we made use of our extrapolated field and Melrose's
quadrupolar current-loop model. The model gave us the flare energy of
of E = 7.5 x 1029 erg which is one order lower then the
observational estimates based on the YOHKOH/SXT irradiation.
Calculations presented here explore only the large-scale magnetic
field structure in the AR. However, taking into account a possible
filamentation of the solar magnetic field, this flare could be
considered as a superposition of many small-scale reconnection events.
In this case, one would expect a variety of angles between small-scale
magnetic fluxes which would bring up the additional energy for the
flare.
The closed magnetic configuration, revealed here, naturally explains
We would like to emphasize that unlike the Kopp-Pneuman
configuration, the model presented here does not necessarily need
destabilization and eruption of the active region filament. The
filament eruption, even if it accompanies a two-ribbon flare, could be
a one of many equal possibilities to trigger a solar flare.
On the other hand, it is also known that there is no direct
link between filament eruption and TRF. Moreover, about 30\% of TRF are
not associated with active region filaments and their sudden
eruption.
Any flare model must explain not only how and where magnetic
energy is released, but also a location, shape and a topological link
between all flare ribbons and remote brightenings seen in the course of
a TRF.
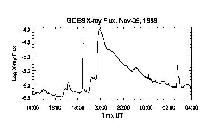 Figure 1 shows GOES soft X-ray flux as a function of
time. There were two large-scale events of energy release. The first
one happened about 19:35 UT.
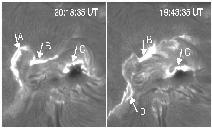 Figure 2 shows H_alpha images of the TRF obtained at the center of the
spectral line. This long duration event lasted for several hours. It
was a large flare which extended over the whole active region. No
filament was present in this AR prior to the flare onset. The H_alpha
image (19:43:35 UT) shows three well developed flare ribbons also
marked with letters A, B, C. The second flare started at about
22:18 UT. After the X-ray flux reached its maximum, the GOES light
curve has broken its gradual decrease and has formed plateau. This
might be also seen in H_alpha images (Figure 2). After the eastern
ribbon A has faded, the south-east ribbon D became
brighter.
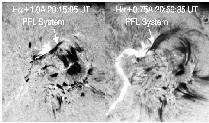 Figure 3 is H_alpha images obtained at the red wing of the spectral
line. The post-flare loop system (dark loops) connected flare ribbons
B and C (which was located just in the umbra of the
sunspot) and showed apparent growth. The off-band images reveal a
strong downflow at the loop footpoints. The image at 20:56:35 UT is a
contrast enhanced image. The flare ribbons appear brighter then it was
observed.
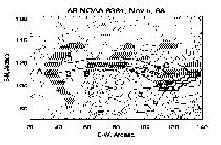 Figure 4 shows locations of H_alpha flare ribbons
(dashed area) and a contour map of the longitudinal magnetic field
(solid - N polarity). Solid lines 1, 2, 3 denote calculated field-lines
connecting the areas a and b with the flare ribbons
A and B. Divides between a, b and c areas
(the thick closed contours) are the intersection of separatrices with
the photosphere and represent the photospheric boundaries of different
magnetic fluxes. These boundaries are places where a drastic change in
the field-line linkage occurs. Discontinuities in the field-line
linkage at the boundary are at the origin of the formation of current
sheets.
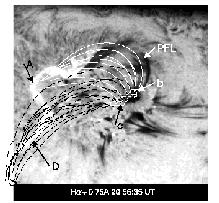 Figure 5 shows H_alpha + 0.75A image taken at 20:56:35 UT. Dark loops
at upper right - growing post-flare loops system (PFL). Solid lines are
calculated field-lines connecting the area b with the flare
ribbon A. Dashed lines - calculated field lines which connect
the area c with the flare ribbon D. The newly formed,
after the first step of reconnection, post flare loops system and the
giant X-ray post-flare arch exhibits apparent growth and thus,
disturbs the pre-existing overlaying magnetic field. This might provoke
the subsequent reconnection of the newly formed loops with the loops
system which connects the area c and the flare ribbon D.
This second-step reconnection should start a bit later than the main
phase of the energy release and corresponds to the second energy
release event see in Figure 1.
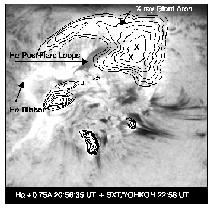 Figure 6 shows the off-band H_alpha image (the same as in Figure 3)
with an overlapped SXT/YOHKOH image. One clearly sees the presence of
both the low-lying H_alpha post-flare loop system (dark loops) and the
overlaying hot X-ray giant coronal arch (a white loop with
contours at the right top corner) according to the model prediction.
©BBSO/NJIT Seminar on OCT, 2000