
This experiment is intended to examine the number and size distribution of dust particles on glass surfaces. We hope to compare these data with scattering data and data on airborne dust in a search for answers to some of the following questions:
Here is a picture of our measurement setup.

The system works by digitizing video images. The images are then processed by a computer program written in the IDL language by David Berger which determines the number and size distribution of the particles.

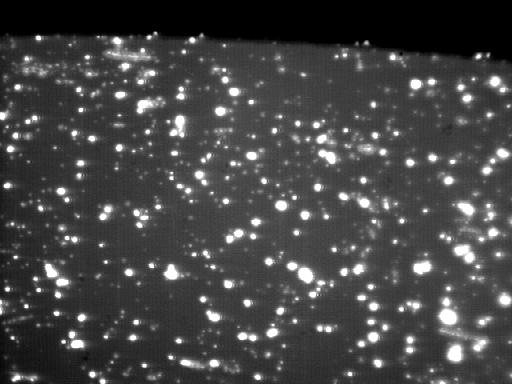
This is not an image of a starfield. This is the dust on a mirror surface photographed using dark field illumination. In other words, what you are seeing is the light scattered by the dust grains on the surface into the microscope objective. The smallest grains are about 2 microns in size. The dark area at the top of the frame is a piece of black tape over the CCD window providing a black reference for the video camera used to obtain the image.
Here we present a typical sequence of dust build-up on a test slide. We present a pair of plots at each stage of contamination. The first plot shows the particle size distribution (particles per mm^2) as a function of particle diameter. The second shows the relative dust cross section contribution as a function of particle diameter.
First we start with a "clean" slide.


After 16.1 hours of exposure (over a one week period) the slide looks like this:


After an additional 20.8 hours (over another one-week period) the slide looks like this:


Finally, after an additional two weeks' exposure (134.6 hours), the slide looks like this:


We would like to thank Mark Klaene of A.P.O. for providing the test slides and mounting them on the telescope for us.